Stack Exchange published some year-end statistics, as they've done for the last few years. Their focus was on looking at how many questions get closed, per site (sometimes a few, sometimes more than 60%) and how many of them get edited and reopened (very few). I don't really care about that, at least at the level of detail they have in some wide tables, but the data includes the number of questions asked for the year, and that piqued my curiosity. My impression has been that activity in general and new questions are down, sometimes a lot, across the network, but I hadn't looked at all the data. Until now.
I downloaded the CSV files for 2018 through 2021. As with all such efforts, the task starts with data-cleaning -- some site names were not consistent across the four files, which messes up sorting and grouping. There are older files, but I got tired of hand-adjusting site names and filling in placeholders for sites that didn't exist that year. While, anecdotally, SE's been in decline for much longer, it feels like things accelerated in 2018 and 2019, so that's what I looked at.
I loaded everything into a spreadsheet for now, just to be able to eyeball it easily. (I might load it into a database later for actual queries, and would include the close-related data if I do that.) I added a "trend" column, up/down/stable, based on eyeballing the data. There were some edge cases that led to me adding an 'erratic" option too. And sometimes it's a judgement call; I didn't work out precise formulas, and some of my "stable"s could be "down"s or vice-versa. I can share the file I assembled, if you want to ignore my assessments and make your own.
The counts include all questions that were asked; we don't know how many were subsequently deleted.
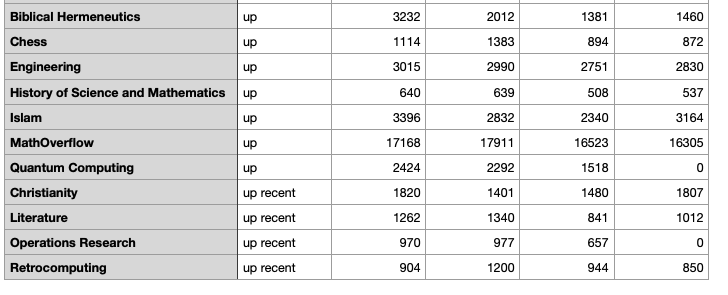
There were a few sites with upward trends:
- Biblical Hermeneutics
- Chess
- Engineering
- History of Science and Math
- Islam
- MathOverflow
- Quantum Computing (which has a corporate sponsor and is a hot research topic)
- Christianity (recent rise)
- Literature (recent rise)
- Operations Research (recent rise, site created in 2020)
- Retrocomputing (recent rise)
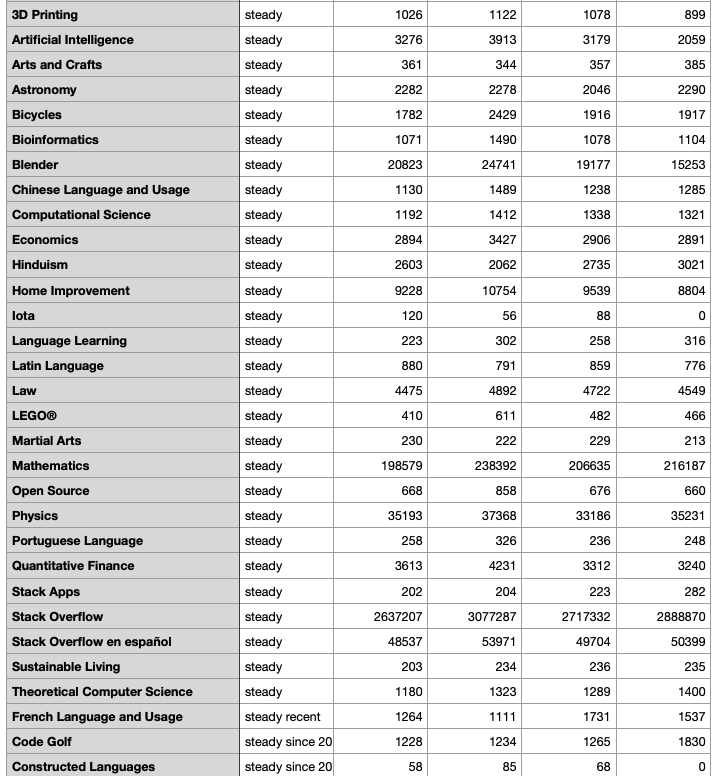
There are about 30 I judged to be steady; while there are fluctuations year to year, the activity is all in the same general ballpark.
The other ~140 sites are having more difficulties.
A few that jumped out at me and/or are of personal interest:
Mi Yodeya had about 4000 questions in 2018. In 2019 there was an organized activity that led to more questions, about 4500. It took a drop after that (~2900 and then ~2600).
Writing was at ~1800 in 2018. 2019 was the year of the question drive and a big push to finally be allowed to graduate. We succeeded, and then six weeks later Stack Overflow Inc. blew up our world. 2021 is down to ~1200, which is actually higher than I expected.
Some technical sites are down by about half, including Software Engineering and Quality Assurance. Hmm.
Cooking went from ~2700 questions in 2018 to ~2300 in each of the next two years and then to ~1500 in 2021. I would have expected that site to get a boost from the pandemic (more people are cooking at home). On the other hand, Travel dropped a ton from 2019 to 2020 (and stayed low for 2021); I think the reason is pretty obvious there.
English Language and Usage dropped by half, from ~22k in 2018. The Workplace is also down by half, from ~5500 to ~2500. Graphic Design is down even more, from ~6800 to ~2700.
Interpersonal Skills had ~2600 questions in 2018. In mid-October of that year, they were kicked off the hot network questions list amidst some controversy, reducing their advertising reach. That doesn't explain everything, but the next year was down by half, and in 2021 they were down to ~450, less than 20% of the number from 2018. Noteworthy: when SE decided to "graduate" almost all remaining beta sites, this one asked to stay in beta. So they seem to recognize that they have things to sort out.
Beer, Wine, and Spirits, which has struggled for years, is down from 151 questions in 2018 to 70 in 2021. Homebrewing is also down by two-thirds.
I couldn't figure out how to make Markdown tables without a ton of manual effort. Here are a few screenshots for the curious.
Sites with upward trends (columns are 2021, 2020, 2019, 2018):

Sites that more or less held steady:

A few I didn't know how to classify:

Recent downward trends:

The rest of the downs:


